


The number of people in England and Wales who were born outside the UK has increased by 2.5 million since 2011, the latest census data shows. The 2021 survey counted 10 million foreign-born people, among a population of 59.5 million in England and Wales. Of these, India was the most common birthplace, with 920,000 people, 1.5% of usual residents, born there.
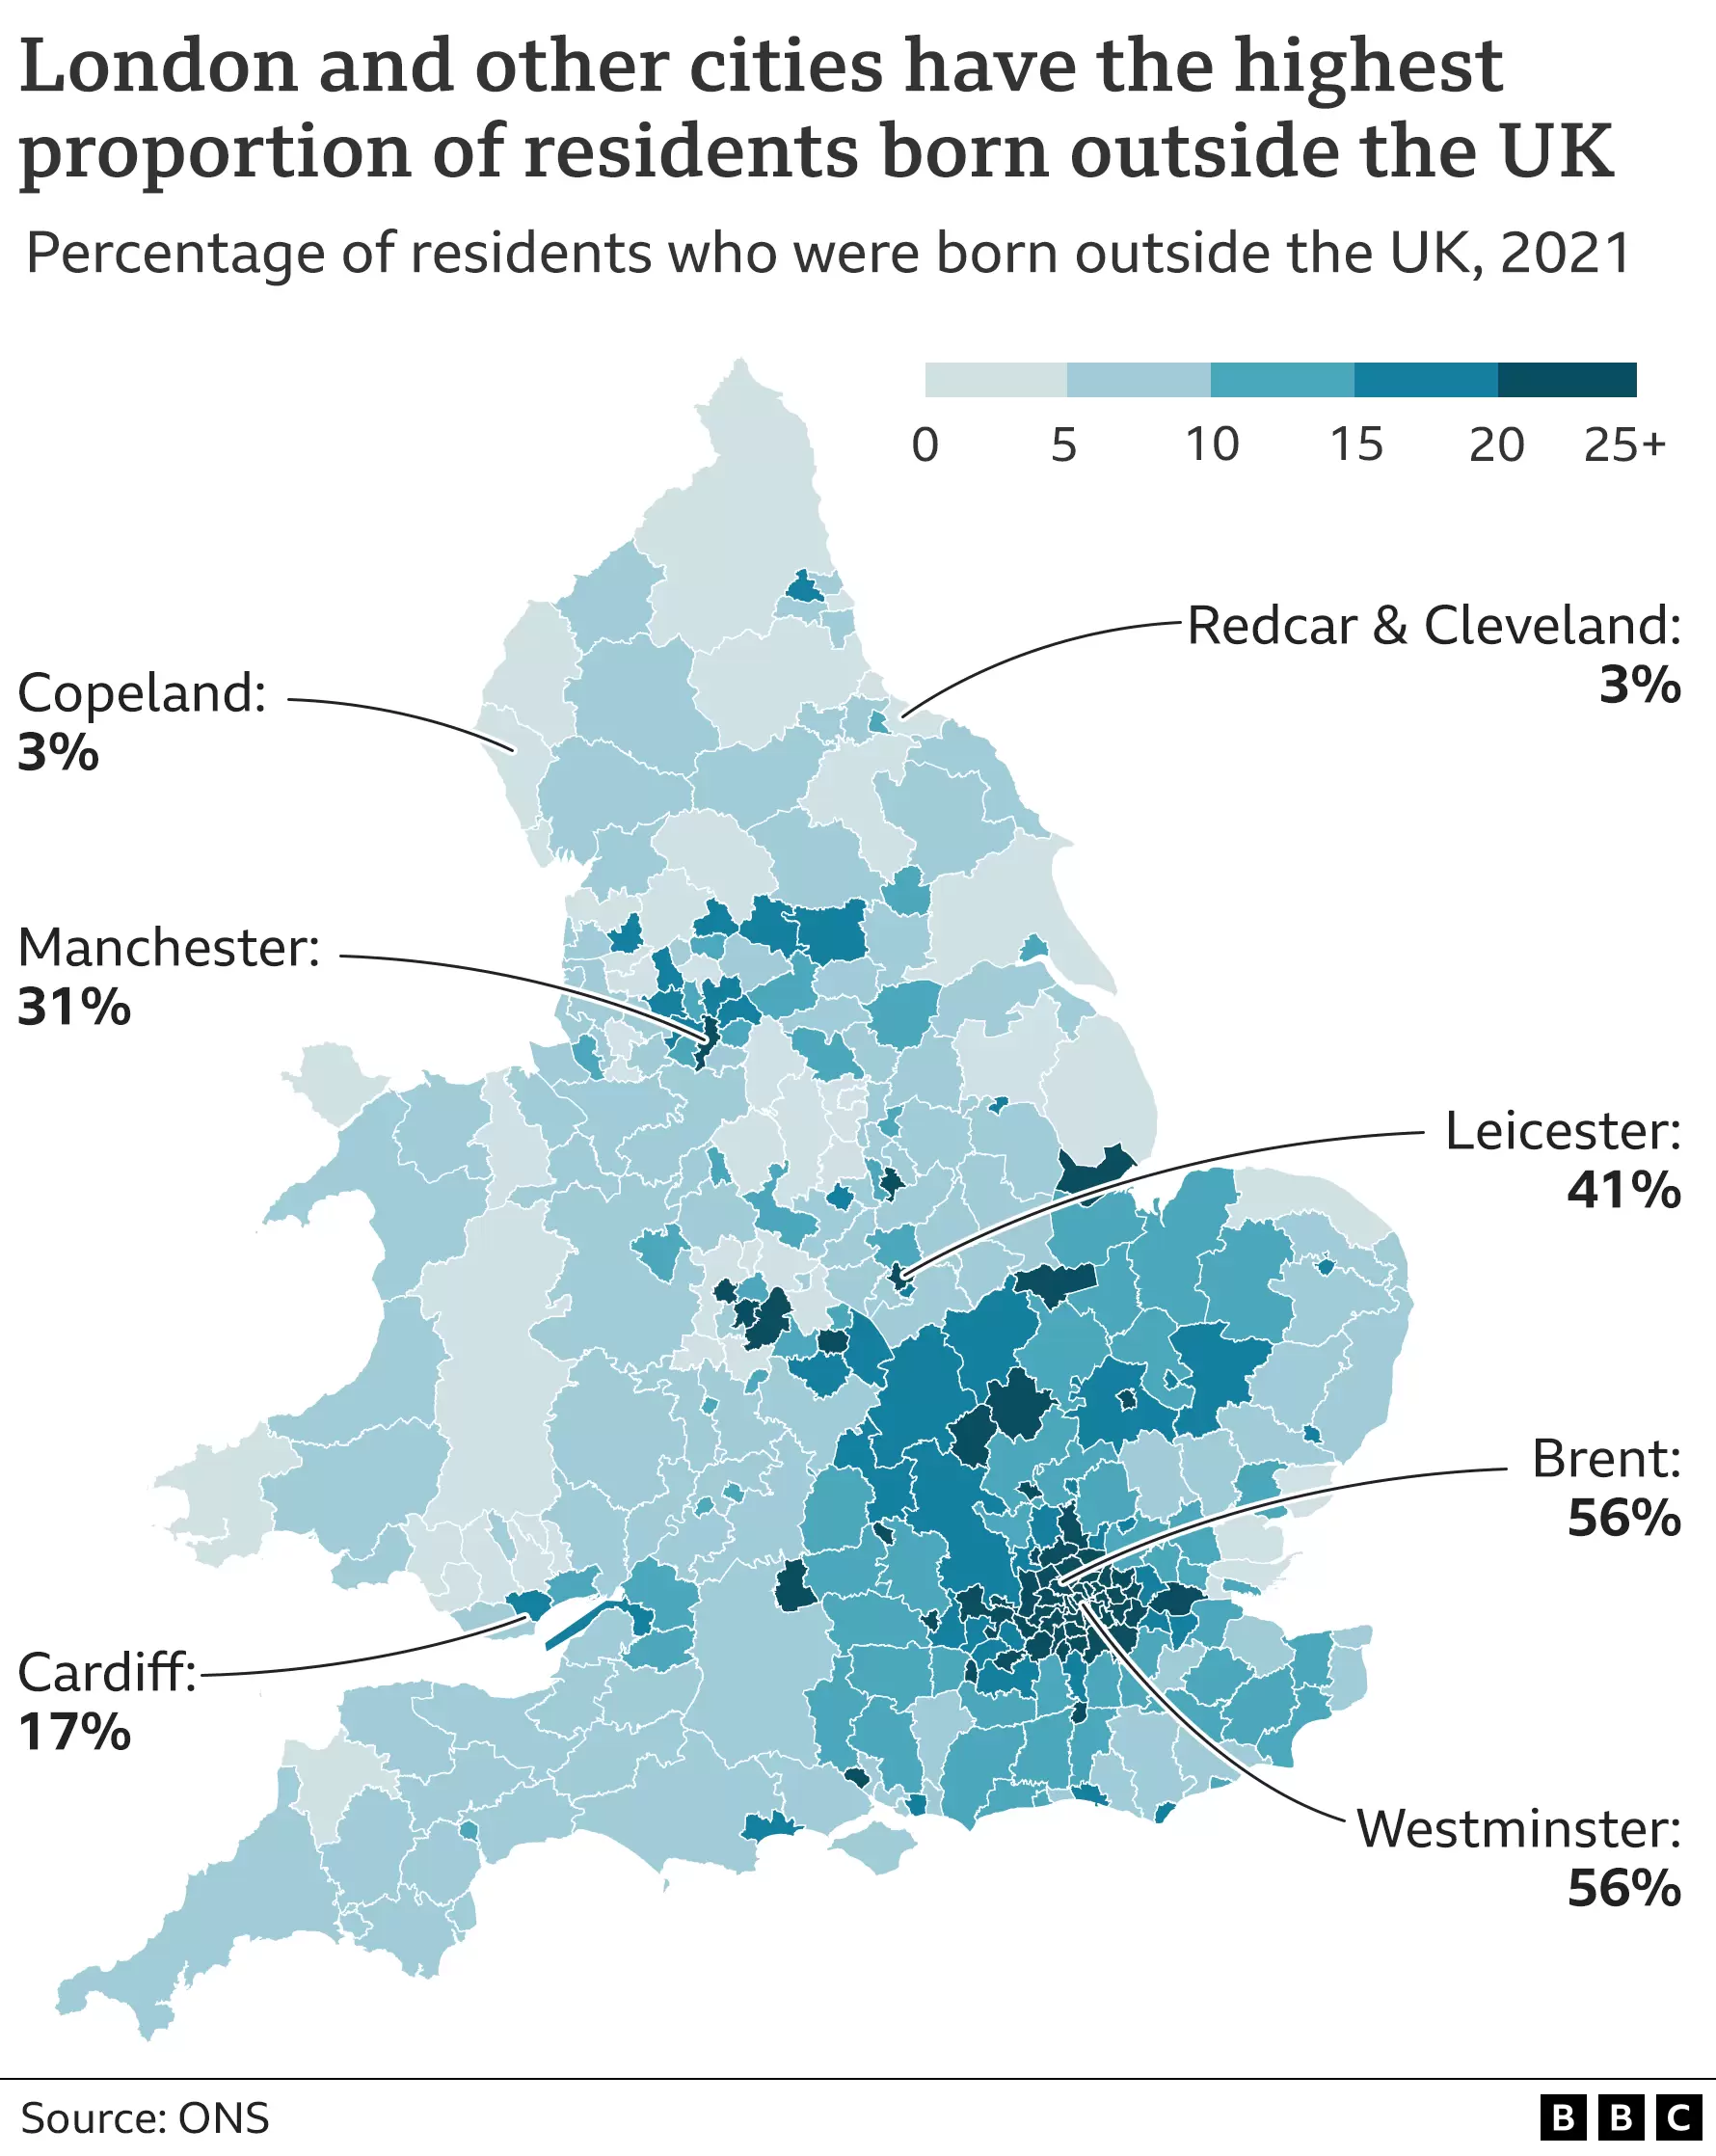
The number of Romanian-born people in England and Wales rose 576% between 2011 and 2021 to 539,000. On census day, 21 March 2021, the combined population of England and Wales was 59,597,542 – up from 56,075,912 in March 2011. “Natural” population increase – the number of deaths subtracted from the number of babies born – accounted for 42.5% of the rise. The other 57.5% was due to positive net migration – the difference between the numbers who immigrated into and emigrated out of England and Wales, amounting to two million people. London is the region with the largest proportion of people born outside the UK. In 2021, more than four in 10 (40.6%) of the capital’s usual residents were non-UK-born. In contrast, both Wales (6.9%) and the northeast of England (6.8%) had approximately one in 14 usual residents born outside the UK.
The census data reveals a huge amount about the population of England and Wales on one specific day in 2021. The figures can be compared with the previous census, in 2011, but this illuminates just two moments in time – they do not reveal what was going on in between. And when it comes to international migration, a lot happened – not least Brexit and significant changes to the immigration system.
The 2021 census refers to “a longer-term trend of an increasing proportion of non-UK-born residents being from within the EU”. And between the two censuses, the number of EU-born citizens increased by 1.1 million. But this hardly tells the whole story. Other data suggests the EU-born population is now declining, with significant social and political consequences. The census shows an almost six-fold increase in the number of Romanians resident in England and Wales since 2011 – but not whether this number is now rising or falling. While fascinating, it has limitations in trying to understand the current dynamics of demography.
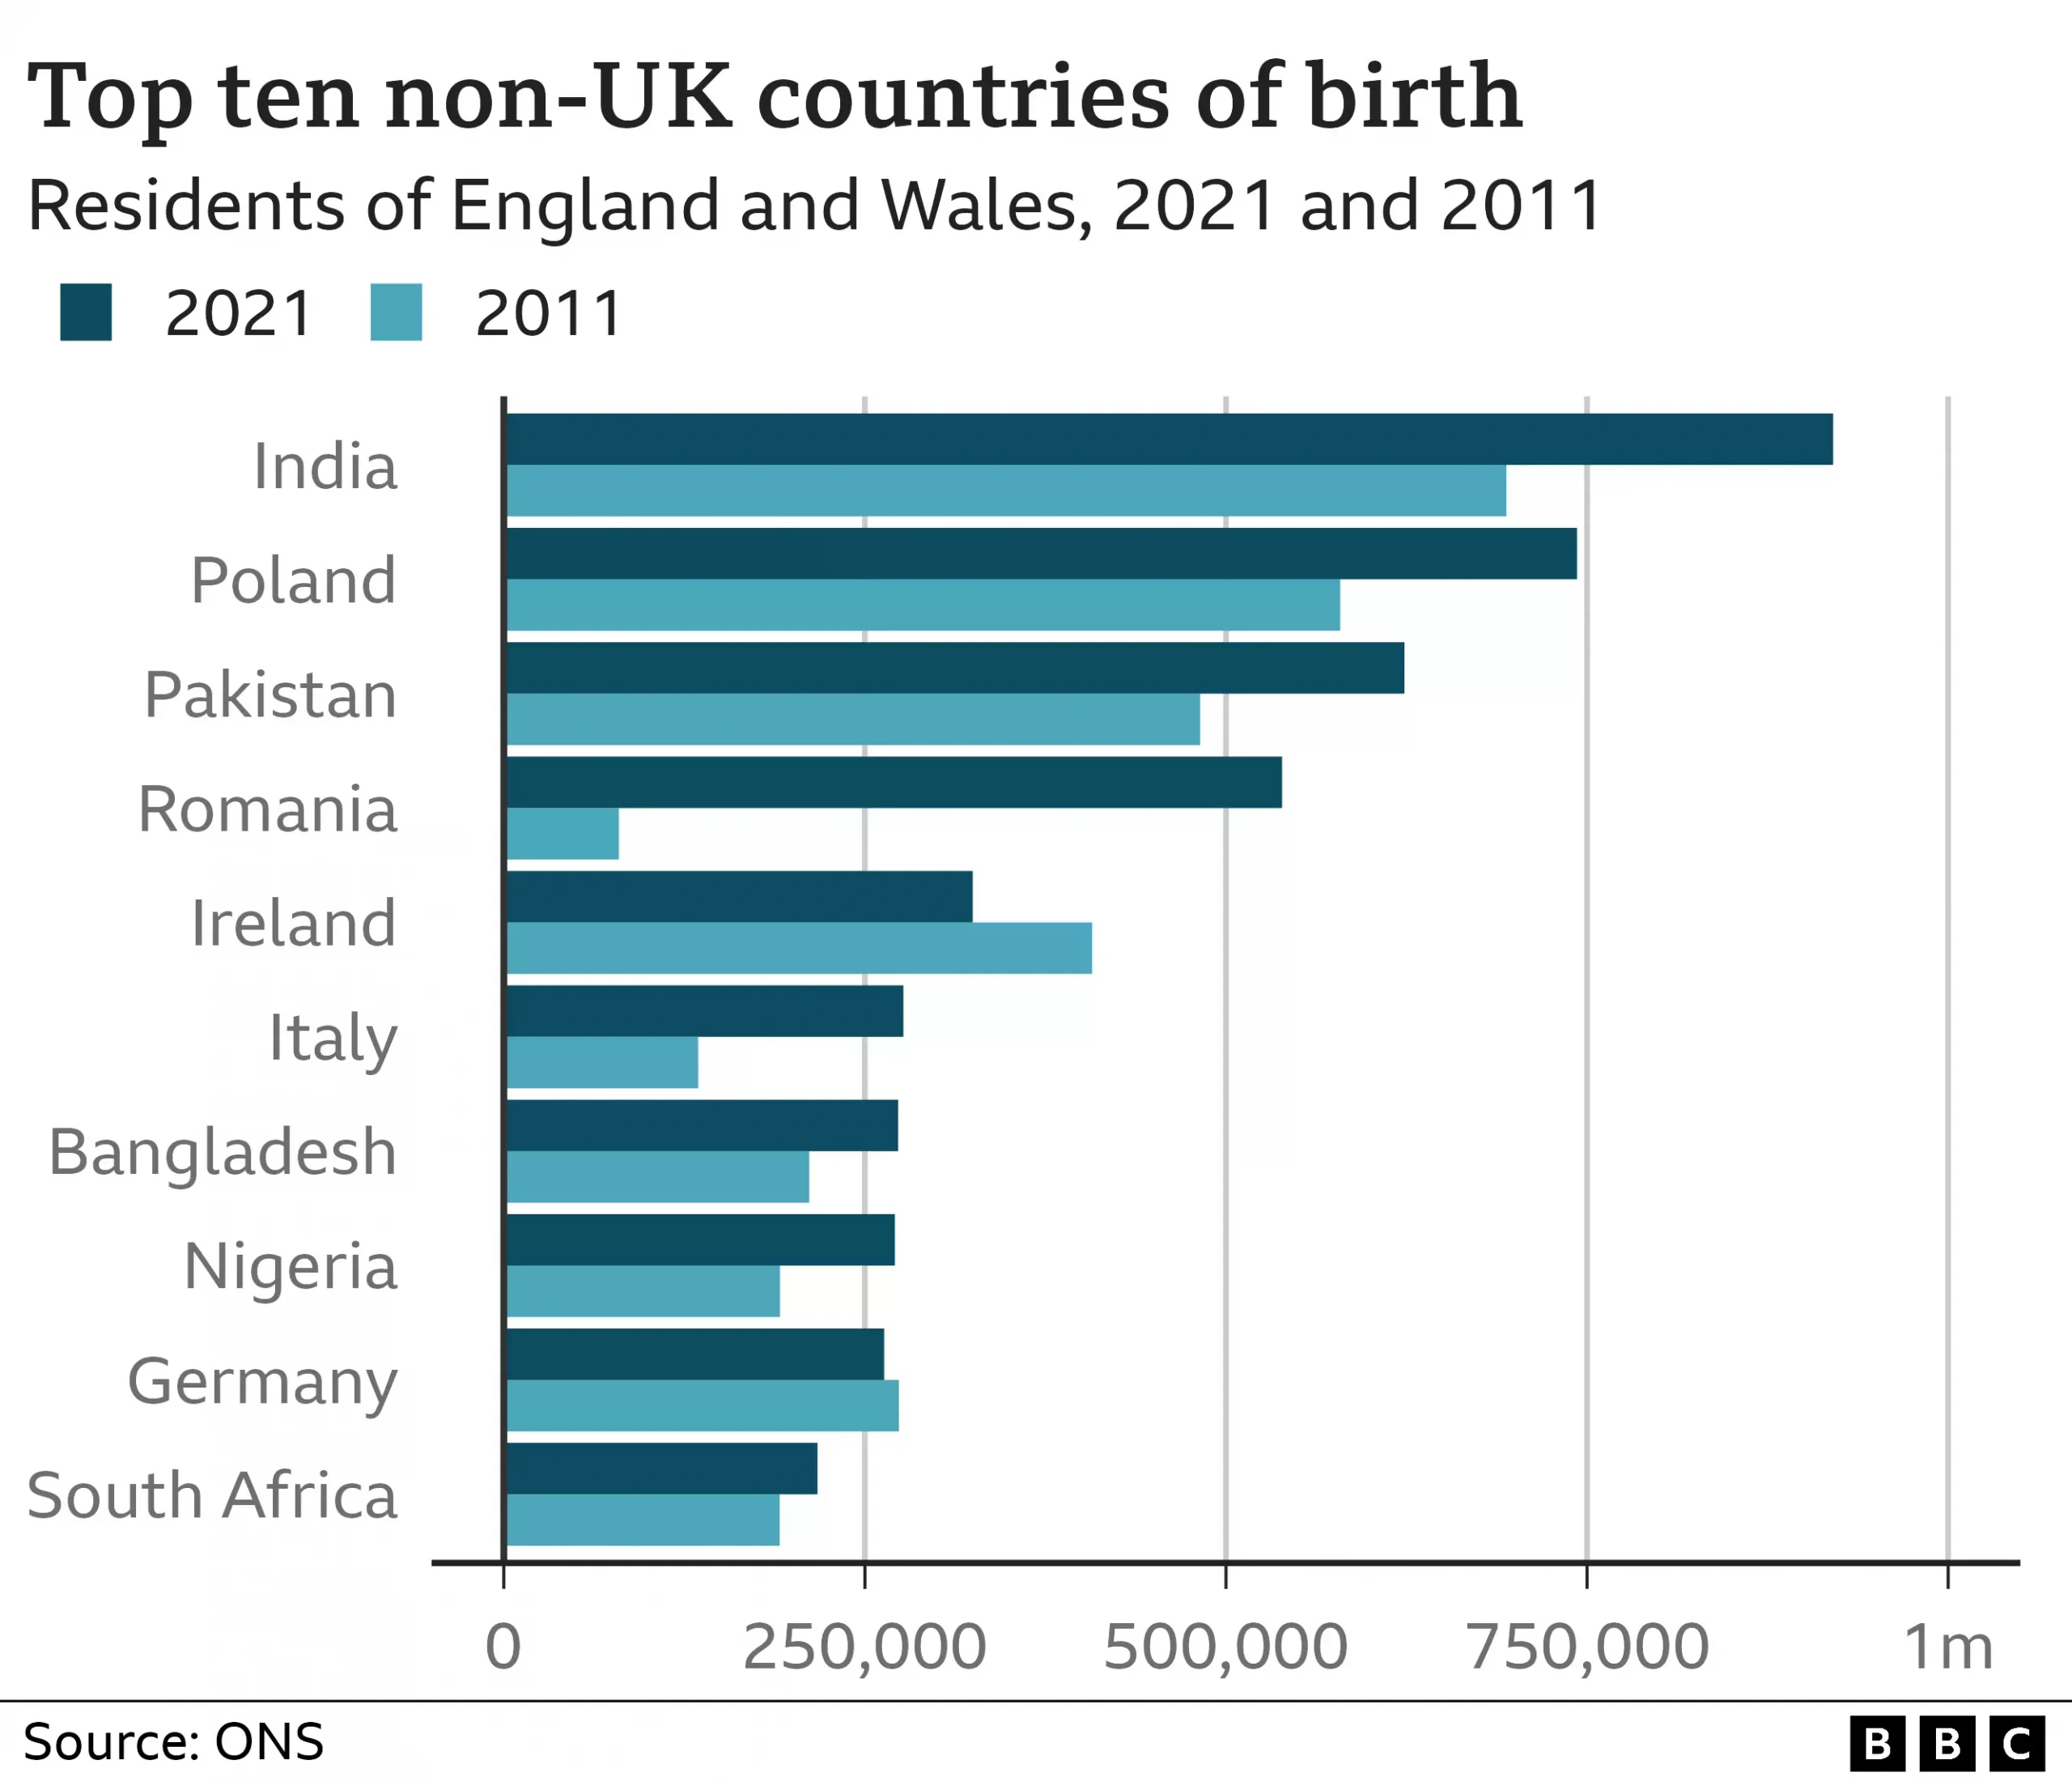
The Republic of Ireland retained its position in the top 10 non-UK countries of birth – but had the greatest decrease, at 20.3%, from 407,000, in 2011, to 325,000, in 2021. The Office for National Statistics has also calculated the average size of households in England and Wales, which remains about the same as in 2011, although the number of them has increased in line with the population. The average household size in England and Wales in 2021 was 2.4 people, as it had been in 2011, but six in 10 are single-family households and three in 10 only have one person.
Census officials say the increase in the number of Romanians was driven by working restrictions for them being lifted in 2014. Italy also entered the top 10 non-UK countries of birth, rising to 277,000 from 135,000 between 2011 and 2021, a 105% increase. “The census tells us about the change over the whole decade – who was living here in March 2021, compared with March 2011,” said census deputy director Jon Wroth-Smith. “We can see Romanians have been a big driver in this change, while there have also been increases due to migration from India, Pakistan, and Poland, as well as southern European countries such as Italy.”
Less deprivation
The number of deprived households fell by 700,000, to 12.8 million, in the 10 years to March 2021, according to the census.
Households were considered deprived if they met one or more of the following criteria:
- any adult unemployed or long-term sick and not a full-time student
- no-one with five or more GCSE passes and no full-time students aged 16-18
- anyone with “bad” or “very bad” general health or a long-term health problem
- in overcrowded accommodation
- without central heating
This change affected every part of England and Wales but with marked regional differences. The highest proportion of deprived households was in the North East, at 54.6% compared with 48% in the South East.
Local authorities with the highest proportion of deprived households included:
- Barking and Dagenham (62.4%) and Sandwell (62.1%), in England
- Blaenau Gwent (61.7%) and Merthyr Tydfil (59.8%), in Wales
![]()